
Zeek
Zeek (formerly Bro) is an open-source and commercial network monitoring tool (traffic analyzer).
The official description; "Zeek (formerly Bro) is the world's leading platform for network security monitoring. Flexible, open-source, and powered by defenders." "Zeek is a passive, open-source network traffic analyser. Many operators use Zeek as a network security monitor (NSM) to support suspicious or malicious activity investigations. Zeek also supports a wide range of traffic analysis tasks beyond the security domain, including performance measurement and troubleshooting."
What is ZEEK?
Zeek (formerly Bro) is an open-source and commercial passive Network Monitoring tool (traffic analysis framework) developed by Lawrence Berkeley Labs. Today, Zeek is supported by several developers, and Corelight provides an Enterprise-ready fork of Zeek. Therefore this tool is called both open source and commercial. The differences between the open-source version and the commercial version are detailed here.
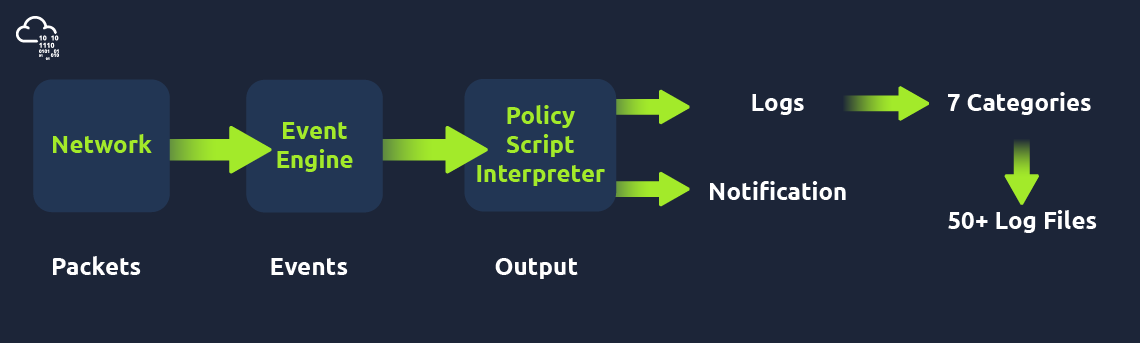
Zeek differs from known monitoring and IDS/IPS tools by providing a wide range of detailed logs ready to investigate both for forensics and data analysis actions. Currently, Zeek provides 50+ logs in 7 categories.
Zeek vs Snort
While both are called IDS/NIDS, it is good to know the cons and pros of each tool and use them in a specific manner. While there are some overlapping functionalities, they have different purposes for usage.
Tool
Zeek
Snort
Capabilities
NSM and IDS framework. It is heavily focused on network analysis. It is more focused on specific threats to trigger alerts. The detection mechanism is focused on events.
An IDS/IPS system. It is heavily focused on signatures to detect vulnerabilities. The detection mechanism is focused on signature patterns and packets.
Cons
Hard to use.
The analysis is done out of the Zeek, manually or by automation.
Hard to detect complex threats.
Pros
It provides in-depth traffic visibility.
Useful for threat hunting.
Ability to detect complex threats.
It has a scripting language and supports event correlation.
Easy to read logs.
Easy to write rules.
Cisco supported rules.
Community support.
Common Use Case
Network monitoring. In-depth traffic investigation. Intrusion detecting in chained events.
Intrusion detection and prevention. Stop known attacks/threats.
Zeek Architecture
Zeek has two primary layers; "Event Engine" and "Policy Script Interpreter". The Event Engine layer is where the packets are processed; it is called the event core and is responsible for describing the event without focusing on event details. It is where the packages are divided into parts such as source and destination addresses, protocol identification, session analysis and file extraction. The Policy Script Interpreter layer is where the semantic analysis is conducted. It is responsible for describing the event correlations by using Zeek scripts.
Zeek Frameworks
Zeek has several frameworks to provide extended functionality in the scripting layer. These frameworks enhance Zeek's flexibility and compatibility with other network components. Each framework focuses on the specific use case and easily runs with Zeek installation. For instance, we will be using the "Logging Framework" for all cases. Having ide on each framework's functionality can help users quickly identify an event of interest.
Available Frameworks
Cluster
Broker Communication
Supervisor
GeoLocation
File Analysis
Signature
Summary
NetControl
Packet Analysis
TLS Decryption
You can read more on frameworks here.
Zeek Outputs
As mentioned before, Zeek provides 50+ log files under seven different categories, which are helpful in various areas such as traffic monitoring, intrusion detection, threat hunting and web analytics.
Once you run Zeek, it will automatically start investigating the traffic or the given pcap file and generate logs automatically. Once you process a pcap with Zeek, it will create the logs in the working directory. If you run the Zeek as a service, your logs will be located in the default log path. The default log path is:/opt/zeek/logs/
The only way to listen to the live network traffic is using Zeek as a service. Apart from using the Zeek as a network monitoring tool, we can also use it as a packet investigator. To do so, we need to process the pcap files with Zeek, as shown below. Once you process a pcap file, Zeek automatically creates log files according to the traffic.
In pcap processing mode, logs are saved in the working directory. You can view the generated logs using the ls -l command.
Zeek Basics Module
Main Zeek command line parameters are explained below.
-r
Reading option, read/process a pcap file.
-C
Ignoring checksum errors.
-v
Version information.
zeekctl
ZeekControl module. Controls running zeek as a service
Zeek Logs
Zeek generates log files according to the traffic data. You will have logs for every connection in the wire, including the application level protocols and fields. Zeek is capable of identifying 50+ logs and categorising them into seven categories. Zeek logs are well structured and tab-separated ASCII files, so reading and processing them is easy but requires effort. You should be familiar with networking and protocols to correlate the logs in an investigation, know where to focus, and find a specific piece of evidence.
Each log output consists of multiple fields, and each field holds a different part of the traffic data. Correlation is done through a unique value called "UID". The "UID" represents the unique identifier assigned to each session.
Zeek logs in a nutshell;
Category
Description
Log Files
Network
Network protocol logs.
conn.log, dce_rpc.log, dhcp.log, dnp3.log, dns.log, ftp.log, http.log, irc.log, kerberos.log, modbus.log, modbus_register_change.log, mysql.log, ntlm.log, ntp.log, radius.log, rdp.log, rfb.log, sip.log, smb_cmd.log, smb_files.log, smb_mapping.log, smtp.log, snmp.log, socks.log, ssh.log, ssl.log, syslog.log, tunnel.log.
Files
File analysis result logs.
files.log, ocsp.log, pe.log, x509.log.
NetControl
Network control and flow logs.
netcontrol.log, netcontrol_drop.log, netcontrol_shunt.log, netcontrol_catch_release.log, openflow.log.
Detection
Detection and possible indicator logs.
intel.log, notice.log, notice_alarm.log, signatures.log, traceroute.log.
Network Observations
Network flow logs.
known_certs.log, known_hosts.log, known_modbus.log, known_services.log, software.log.
Miscellaneous
Additional logs cover external alerts, inputs and failures.
barnyard2.log, dpd.log, unified2.log, unknown_protocols.log, weird.log, weird_stats.log.
Zeek Diagnostic
Zeek diagnostic logs cover system messages, actions and some statistics.
broker.log, capture_loss.log, cluster.log, config.log, loaded_scripts.log, packet_filter.log, print.log, prof.log, reporter.log, stats.log, stderr.log, stdout.log.
Please refer to Zeek's official documentation and Corelight log cheat sheet for more information. Although there are multiple log files, some log files are updated daily, and some are updated in each session. Some of the most commonly used logs are explained in the given table.
Update Frequency
Log Name
Description
Daily
known_hosts.log
List of hosts that completed TCP handshakes.
Daily
known_services.log
List of services used by hosts.
Daily
known_certs.log
List of SSL certificates.
Daily
software.log
List of software used on the network.
Per Session
notice.log
Anomalies detected by Zeek.
Per Session
intel.log
Traffic contains malicious patterns/indicators.
Per Session
signatures.log
List of triggered signatures.
This is too much protocol and log information! Yes, it is true; a difficulty of working with Zeek is having the required network knowledge and investigation mindset. Don't worry; you can have both of these and even more knowledge by working through TryHackMe paths. Just keep the streak!
Brief log usage primer table;
conn.log
http.log
notice.log
known_host.log
files.log
dns.log
signatures.log
known_services.log
intel.log
ftp.log
pe.log
software.log
loaded_scripts.log
ssh.log
traceroute.log
weird.log
You can categorise the logs before starting an investigation. Thus, finding the evidence/anomaly you are looking for will be easier. The given table is a brief example of using multiple log files. You can create your working model or customise the given one. Make sure you read each log description and understand the purpose to know what to expect from the corresponding log file. Note that these are not the only ones to focus on. Investigated logs are highly associated with the investigation case type and hypothesis, so do not just rely only on the logs given in the example table!
The table shows us how to use multiple logs to identify anomalies and run an investigation by correlating across the available logs.
Overall Info: The aim is to review the overall connections, shared files, loaded scripts and indicators at once. This is the first step of the investigation.
Protocol Based: Once you review the overall traffic and find suspicious indicators or want to conduct a more in-depth investigation, you focus on a specific protocol.
Detection: Use the prebuild or custom scripts and signature outcomes to support your findings by having additional indicators or linked actions.
Observation: The summary of the hosts, services, software, and unexpected activity statistics will help you discover possible missing points and conclude the investigation.
Remember, we mention the pros and cons of the Zeek logs at the beginning of this task. Now let's demonstrate the log viewing and identify the differences between them.
Recall 1: Zeek logs are well structured and tab-separated ASCII files, so reading and processing them is easy but requires effort.
Recall 2: Investigating the generated logs will require command-line tools (cat, cut, grep sort, and uniq) and additional tools (zeek-cut).
In addition to Linux command-line tools, one auxiliary program called zeek-cut reduces the effort of extracting specific columns from log files. Each log file provides "field names" in the beginning. This information will help you while using zeek-cut. Make sure that you use the "fields" and not the "types".
Zeek-cut
Cut specific columns from zeek logs.
Zeek Signatures
Zeek supports signatures to have rules and event correlations to find noteworthy activities on the network. Zeek signatures use low-level pattern matching and cover conditions similar to Snort rules. Unlike Snort rules, Zeek rules are not the primary event detection point. Zeek has a scripting language and can chain multiple events to find an event of interest. We focus on the signatures in this task, and then we will focus on Zeek scripting in the following tasks.
Zeek signatures are composed of three logical paths; signature id, conditions and action. The signature breakdown is shown in the table below;
Signature id
Unique signature name.
Conditions
Header: Filtering the packet headers for specific source and destination addresses, protocol and port numbers.Content: Filtering the packet payload for specific value/pattern.
Action
Default action: Create the "signatures.log" file in case of a signature match.
Additional action: Trigger a Zeek script.
Now let's dig more into the Zeek signatures. The below table provides the most common conditions and filters for the Zeek signatures.
Condition Field
Available Filters
Header
src-ip: Source IP.dst-ip: Destination IP.src-port: Source port.dst-port: Destination port.ip-proto: Target protocol. Supported protocols; TCP, UDP, ICMP, ICMP6, IP, IP6
Content
payload: Packet payload. http-request: Decoded HTTP requests. http-request-header: Client-side HTTP headers. http-request-body: Client-side HTTP request bodys. http-reply-header: Server-side HTTP headers. http-reply-body: Server-side HTTP request bodys. ftp: Command line input of FTP sessions.
Context
same-ip: Filtering the source and destination addresses for duplication.
Action
event: Signature match message.
Comparison Operators
==, !=, <, <=, >, >=
NOTE!
Filters accept string, numeric and regex values.
Run Zeek with signature file
Zeek signatures use the ".sig" extension.
-C: Ignore checksum errors. -r: Read pcap file.-s: Use signature file.
Example | Cleartext Submission of Password
Let's create a simple signature to detect HTTP cleartext passwords.
Remember, Zeek signatures support regex. Regex ".*" matches any character zero or more times. The rule will match when a "password" phrase is detected in the packet payload. Once the match occurs, Zeek will generate an alert and create additional log files (signatures.log and notice.log).
Signature Usage and Log Analysis
As shown in the above terminal output, the signatures.log and notice.log provide basic details and the signature message. Both of the logs also have the application banner field. So it is possible to know where the signature match occurs. Let's look at the application banner!
Log Analysis
We will demonstrate only one log file output to avoid duplication after this point. You can practice discovering the event of interest by analysing notice.log and signatures.log.
Example | FTP Brute-force
Let's create another rule to filter FTP traffic. This time, we will use the FTP content filter to investigate command-line inputs of the FTP traffic. The aim is to detect FTP "admin" login attempts. This basic signature will help us identify the admin login attempts and have an idea of possible admin account abuse or compromise events.
Let's run the Zeek with the signature and investigate the signatures.log and notice.log.
FTP Signature
Our rule shows us that there are multiple logging attempts with account names containing the "admin" phrase. The output gives us great information to notice if there is a brute-force attempt for an admin account.
This signature can be considered a case signature. While it is accurate and works fine, we need global signatures to detect the "known threats/anomalies". We will need those case-based signatures for significant and sophistical anomalies like zero-days and insider attacks in the real-life environment. Having individual rules for each case will create dozens of logs and alerts and cause missing the real anomaly. The critical point is logging logically, not logging everything.
We can improve our signature by not limiting the focus only to an admin account. In that case, we need to know how the FTP protocol works and the default response codes. If you don't know these details, please refer to RFC documentation.
Let's optimize our rule and make it detect all possible FTP brute-force attempts.
This signature will create logs for each event containing "FTP 530 response", which allows us to track the login failure events regardless of username.
Zeek signature files can consist of multiple signatures. Therefore we can have one file for each protocol/situation/threat type. Let's demonstrate this feature in our global rule.
Let's merge both of the signatures in a single file. We will have two different signatures, and they will generate alerts according to match status. The result will show us how we benefit from this action. Again, we will need the "CLI Kung-Fu" skills to extract the event of interest.
This rule should show us two types of alerts and help us to correlate the events by having "FTP Username Input" and "FTP Brute-force Attempt" event messages. Let's investigate the logs. We're grepping the logs in range 1001-1004 to demonstrate that the first rule matches two different accounts (admin and administrator).
FTP Signature
Zeek Scripts
Zeek has its own event-driven scripting language, which is as powerful as high-level languages and allows us to investigate and correlate the detected events. Since it is as capable as high-level programming languages, you will need to spend time on Zeek scripting language in order to become proficient. In this room, we will cover the basics of Zeek scripting to help you understand, modify and create basic scripts. Note that scripts can be used to apply a policy and in this case, they are called policy scripts.
Zeek has base scripts installed by default, and these are not intended to be modified.
These scripts are located in "/opt/zeek/share/zeek/base".
User-generated or modified scripts should be located in a specific path.
These scripts are located in "/opt/zeek/share/zeek/site".
Policy scripts are located in a specific path.
These scripts are located in "/opt/zeek/share/zeek/policy".
Like Snort, to automatically load/use a script in live sniffing mode, you must identify the script in the Zeek configuration file. You can also use a script for a single run, just like the signatures.
The configuration file is located in "/opt/zeek/share/zeek/site/local.zeek".
Zeek scripts use the ".zeek" extension.
Do not modify anything under the "zeek/base" directory. User-generated and modified scripts should be in the "zeek/site" directory.
You can call scripts in live monitoring mode by loading them with the command
load @/script/pathorload @script-namein local.zeek file.Zeek is event-oriented, not packet-oriented! We need to use/write scripts to handle the event of interest.
running Zeek with signature
Sample Zeek Script
There are multiple options to trigger conditions in Zeek. Zeek can use "Built-In Function" (Bif) and protocols to extract information from traffic data. You can find supported protocols and Bif either by looking in your setup or visiting the Zeek repo.
Customized Zeek script locations
/opt/zeek/share/zeek/base/bif
/opt/zeek/share/zeek/base/bif/plugins
/opt/zeek/share/zeek/base/protocols
Zeek scripting playground
Zeek Event Types
Scripts 101 | Write Basic Scripts
Scripts contain operators, types, attributes, declarations and statements, and directives. Let's look at a simple example event called "zeek_init" and "zeek_done". These events work once the Zeek process starts and stops. Note that these events don't have parameters, and some events will require parameters.
Run Zeek with the script
The above output shows how the script works and provides messages on the terminal. Zeek will create logs in the working directory separately from the scripts tasks.
Let's print the packet data to the terminal and see the raw data. In this script, we are requesting details of a connection and extracting them without any filtering or sorting of the data. To accomplish this, we are using the "new_connection" event. This event is automatically generated for each new connection. This script provides bulk information on the terminal. We need to get familiar with Zeek's data structure to reduce the amount of information and focus on the event of interest. To do so, we need to investigate the bulk data.
Run Zeek with the script
The above terminal provides bulk data for each connection. This style is not the best usage, and in real life, we will need to filter the information for specific purposes. If you look closely at the output, you can see an ID and field value for each part.
To filter the event of interest, we will use the primary tag (in this case, it is c --comes from "c: connection"--), id value (id=), and field name. You should notice that the fields are the same as the fields in the log files.
Now you have a general idea of running a script and following the provided output on the console. Let's look closer to another script that extracts specific information from packets. The script above creates logs and prompts each source and destination address for each connection.
Let's see this script in action.
Run Zeek with a script
The above output shows that we successfully extract specific information from the events. Remember that this script extracts the event of interest (in this example, a new connection), and we still have logs in the working directory. We can always modify and optimise the scripts at any time.
Scripts 201 | Use Scripts and Signatures Together
Up to here, we covered the basics of Zeek scripts. Now it is time to use scripts collaboratively with other scripts and signatures to get one step closer to event correlation. Zeek scripts can refer to signatures and other Zeek scripts as well. This flexibility provides a massive advantage in event correlation.
Let's demonstrate this concept with an example. We will create a script that detects if our previously created "ftp-admin" rule has a hit.
This basic script quickly checks if there is a signature hit and provides terminal output to notify us. We are using the "signature_match" event to accomplish this. You can read more about events here. Note that we are looking only for "ftp-admin" signature hits. The signature is shown below.
Let's see this script in action.
Run Zeek with signature and script
The above output shows that we successfully combined the signature and script. Zeek processed the signature and logs then the script controlled the outputs and provided a terminal output for each rule hit.
Scripts 202 | Load Local Scripts
Load all local scripts
We mentioned that Zeek has base scripts located in "/opt/zeek/share/zeek/base". You can load all local scripts identified in your "local.zeek" file. Note that base scripts cover multiple framework functionalities. You can load all base scripts by easily running the local command.
Load local scripts
The above output demonstrates how to run all base scripts using the "local" command. Look at the above terminal output; Zeek provided additional log files this time. Loaded scripts generated loaded_scripts.log, capture_loss.log, notice.log, stats.log files. Note that, in our instance, 465 scripts loaded and used by using the "local" command. However, Zeek doesn't provide log files for the scripts doesn't have hits or results.
Load Specific Scripts
Another way to load scripts is by identifying the script path. In that case, you have the opportunity of loading a specific script or framework. Let's go back to FTP brute-forcing case. We created a script that detects multiple admin login failures in previous steps. Zeek has an FTP brute-force detection script as well. Now let's use the default script and identify the differences.
Load local scripts
The above output shows how to load a specific script. This script provides much more information than the one we created. It provides one single line output and a connection summary for the suspicious incident. You can find and read more on the prebuilt scripts and frameworks by visiting Zeek's online book here.
Scripts 203 | Load Frameworks
Zeek has 15+ frameworks that help analysts to discover the different events of interest. In this task, we will cover the common frameworks and functions. You can find and read more on the prebuilt scripts and frameworks by visiting Zeek's online book here.
File Framework | Hashes
Not all framework functionalities are intended to be used in CLI mode. The majority of them are used in scripting. You can easily see the usage of frameworks in scripts by calling a specific framework as load @ $PATH/base/frameworks/framework-name. Now, let's use a prebuilt function of the file framework and have MD5, SHA1 and SHA256 hashes of the detected files. We will call the "File Analysis" framework's "hash-all-files" script to accomplish this. Before loading the scripts, let's look at how it works.
View file framework
The above output shows how frameworks are loaded. In earlier tasks, we mentioned that Zeek highly relies on scripts, and the frameworks depend on scripts. Let's have a closer look at the file hash framework and see the script behind it.
View file framework
Now let's execute the script and investigate the log file.
Grab file hashes
Look at the above terminal outputs. Both of the scripts provided the same result. Here the preference is up to the user. Both of the usage formats are true. Prebuilt frameworks are commonly used in scriptings with the "@load" method. Specific scripts are used as practical scripts for particular use cases.
File Framework | Extract Files
The file framework can extract the files transferred. Let's see this feature in action!
Extract files
We successfully extracted files from the pcap. A new folder called "extract_files" is automatically created, and all detected files are located in it. First, we will list the contents of the folder, and then we will use the file command to determine the file type of the extracted files.
Investigate files
Zeek extracted three files. The "file" command shows us one .txt file, one .doc/.docx file and one .exe file. Zeek renames extracted files. The name format consists of four values that come from conn.log and files.log files; default "extract" keyword, timestamp value (ts), protocol (source), and connection id (conn_uids). Let's look at the files.log to understand possible anomalies better and verify the findings. Look at the below output; files.log provides the same results with additional details. Let's focus on the .exe and correlate this finding by searching its connection id (conn_uids).
The given terminal output shows us that there are three files extracted from the traffic capture. Let's look at the file.log and correlate the findings with the rest of the log files.
Investigate files
The "grep" tool helps us investigate the particular value across all available logs. The above terminal output shows us that the connection id linked with .exe appears in conn.log, files.log, and http.log files. Given example demonstrates how to filter some fields and correlate the findings with the rest of the logs. We've listed the source and destination addresses, file and connection id numbers, MIME types, and file names. Up to now, provided outputs and findings show us that record number three is a .exe file, and other log files provide additional information.
Notice Framework | Intelligence
The intelligence framework can work with data feeds to process and correlate events and identify anomalies. The intelligence framework requires a feed to match and create alerts from the network traffic. Let's demonstrate a single user-generated threat intel file and let Zeek use it as the primary intelligence source.
Intelligence source location: /opt/zeek/intel/zeek_intel.txt
There are two critical points you should never forget. First, the source file has to be tab-delimited. Second, you can manually update the source and adding extra lines doesn't require any re-deployment. However, if you delete a line from the file, you will need to re-deploy the Zeek instance.
Let's add the suspicious URL gathered from the case1.pcap file as a source intel and see this feature in action! Before executing the script, let's look at the intelligence file and the script contents.
Investigate intel file and script
The above output shows the contents of the intel file and script contents. There is one intelligence input, and it is focused on a domain name, so when this domain name appears in the network traffic, Zeek will create the "intel.log" file and provide the available details.
The above output shows that Zeek detected the listed domain and created the intel.log file. This is one of the easiest ways of using the intelligence framework. You can read more on the intelligence framework here and here.
Scripts 204 | Package Manager
Zeek Package Manager helps users install third-party scripts and plugins to extend Zeek functionalities with ease. The package manager is installed with Zeek and available with the zkg command. Users can install, load, remove, update and create packages with the "zkg" tool. You can read more on and view available packages here and here. Please note that you need root privileges to use the "zkg" tool.
Basic usage of zkg;
zkg install package_path
Install a package. Example (zkg install zeek/j-gras/zeek-af_packet-plugin).
zkg install git_url
Install package. Example (zkg install https://github.com/corelight/ztest).
zkg list
List installed package.
zkg remove
Remove installed package.
zkg refresh
Check version updates for installed packages.
zkg upgrade
Update installed packages.
There are multiple ways of using packages. The first approach is using them as frameworks and calling specific package path/directory per usage. The second and most common approach is calling packages from a script with the "@load" method. The third and final approach to using packages is calling their package names; note that this method works only for packages installed with the "zkg" install method.
Packages | Cleartext Submission of Password
Let's install a package first and then demonstrate the usage in different approaches. Note: The package is installed in the given VM.
Install package with zkg
The above output shows how to install and list the installed packages. Now we successfully installed a package. As the description mentions on the above terminal, this package creates alerts for cleartext passwords found in HTTP traffic. Let's use this package in three different ways!
Execute/load package
The above output demonstrates how to execute/load packages against a pcap. You can use the best one for your case. The "zeek-sniffpass" package provides additional information in the notice.log file. Now let's review the logs and discover the obtained data using the specific package.
Investigate log files
The above output shows that the package found cleartext password submissions, provided notice, and grabbed the usernames. Remember, in TASK-5 we created a signature to do the same action. Now we can do the same activity without using a signature file. This is a simple demonstration of the benefit and flexibility of the Zeek scripts.
Packages | Geolocation Data
Let's use another helpful package called "geoip-conn". This package provides geolocation information for the IP addresses in the conn.log file. It depends on "GeoLite2-City.mmdb" database created by MaxMind. This package provides location information for only matched IP addresses from the internal database.
Execute/load package
Up to now, we've covered what the Zeek packages are and how to use them. There are much more packages and scripts available for Zeek in the wild. You can try ready or third party packages and scripts or learn Zeek scripting language and create new ones.
Last updated